



When it comes to investments in supply chain automation, the question most managers ask is almost always the same: “how much will it cost me?” The concept is straightforward: return on investment (ROI) is calculated by subtracting the cost incurred from the value generated, then dividing the result by the capital invested.
But does the same logic apply to a complex supply chain automation project?
To find out, we spoke with Emilio Collot, Sales Director at Stesi, with over 15 years of experience in process digitalisation projects. Having engaged with more than 300 companies throughout their supply chain evolution journeys, he has built deep expertise in industrial automation. In this article, he will guide us through the right approach to calculating the ROI of a logistics project.
What is ROI in supply chain?
ROI (Return on Investment) measures the value generated by an investment relative to the capital employed. The most common formula states that ROI = (revenue generated minus costs incurred) / costs incurred × 100. But when it comes to a logistics project, too many companies evaluate ROI by looking only at the most easily measurable costs (such as software, automation equipment or consultancy fees), without accounting for all the real costs the business faces.
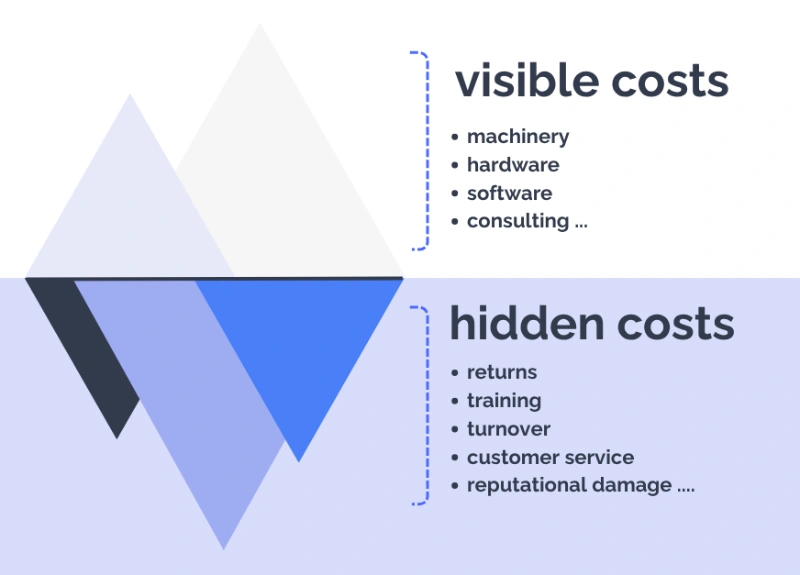
“The return on investment in logistics is often calculated in an overly simplistic way“, Emilio points out. “What does the typical business owner or manager do? They look at the cost of the project, the consultancy or the tool, because that is the easiest thing to evaluate. In reality, to truly calculate return on investment you need to go deeper and ask a simple question: how much is my inefficiency actually costing me?” When evaluating a supply chain investment, the cost of software, hardware and consultancy is immediately visible. Inefficiency, on the other hand, rarely comes with a separate invoice: it hides in lost minutes, urgent interventions, rework, returns, safety stock, overtime and decisions made on incomplete data.
Take the picking phase in a warehouse as an example. A picking error is not simply a matter of grabbing the wrong folder. We know that a picking error brings with it customer complaints, returns, wasted time and money. A missed production unit, meanwhile, carries the risk of reputational damage and additional customer service hours.
Logistics and supply chain involve an extremely high number of variables, which inevitably complicates the ROI calculation for any automation project. “So when we talk about logistics ROI, what we are really talking about is the value of eliminating a headache: the value derived from resolving a process inefficiency“, Emilio Collot explains. In turn, this widespread difficulty in quantifying and justifying return on investment becomes the main barrier that holds companies back from investing in automation and operational improvement.
ROI in supply chain: how to calculate it?
First rule: start from your own baseline, not from generic industry benchmarks.
It is useful to know that a supply chain investment typically pays back within a certain number of months, but every project, with its own complexity and nuances, is different from all the others. “Two companies that buy the same solution can achieve very different results, because they inevitably start from different levels of inefficiency, operational discipline and data quality“, Emilio explains.
The baseline must capture at least 4 to 8 weeks of real operational activity, including peaks, exceptions and seasonality:
- average time per picking, replenishment and put-away mission
- metres or minutes travelled per order line
- errors per 1,000 lines, and associated returns and rework
- inventory accuracy by product family, location and load unit
- overtime hours, temporary staffing and headcount deployed during peaks
- training time required to bring a new operator to full autonomy
- order-to-customer throughput time and percentage of orders fulfilled on time
- waiting times for trucks, bays, production lines and internal operators.
From this baseline, the benefits expected from the project must be categorised and identified upfront, and their measurement methods defined.
| Tangible improvements | Intangible improvements | Risks avoided | Strategic benefits |
| reduced labour and management costs | improved service levels | stoppages | more reliable data |
| less overtime | customer satisfaction | incidents and injuries | process standardisation |
| fewer errors and returns | improved retention | labour shortages | scalability |
| reduced stock | improved quality of work | dependency on individual memory | real-time analytics |
| optimised space | improved employee morale |
“The problem is that many supply chain costs are not visible, not obvious. They are often hidden and invisible“, our Sales Director explains. In production, logistics and transport, the pitfalls that cause inefficiencies and financial losses hide in subtle ways: they need to be sought out, identified and resolved.
When evaluating a logistics automation investment, it is easy to stop at the most obvious costs. Here are some indirect costs that are frequently underestimated but have a concrete impact on margins:
- time spent training new operators on poorly standardised processes
- cost of returns generated by picking, dispatch or labelling errors
- customer service time spent handling complaints
- opportunity cost of operator time spent on low-value activities (manual searching for items, reconstructing missing data, and so on)
- staff turnover caused by repetitive, frustrating tasks poorly supported by technology
- reputational damage resulting from recurring delivery delays or errors
- overstock or stockouts caused by unreliable inventory visibility
To calculate the ROI of a supply chain project, it is therefore essential to identify all the costs that are genuinely eroding margin. “I need to map the processes, understand where my inefficiencies are, resolve my issues, measure the key metrics and then keep improving the process accordingly”, Emilio emphasises. The starting point is a fundamental concept: logistics KPIs, meaning the evaluation of the outcomes of the improvement process that has been carried out.

Here is an operational framework to guide the calculation of ROI in logistics and supply chain:
1. Define the scope: process, site, volumes, shifts, product families, constraints
2. Collect the baseline (at least 4 to 8 weeks)
3. Map the process end-to-end, not just a single function
4. Identify loss points: waiting times, searching, rework, transfers, urgent interventions, manual checks
5. Distinguish hard savings, soft savings, risks avoided and strategic benefits
6. Calculate the full TCO: software, hardware, integration, training, support, maintenance, licences
7. Build at least three scenarios: conservative, realistic and optimistic
8. Include time-to-value and a progressive adoption curve
9. Define post go-live KPIs, owners, measurement frequency and intervention thresholds
In short: the standard revenue minus costs formula is a good starting point, but it is essential to ensure that all real costs and all real benefits are taken into account.
Every project is different, of course, and ROI depends on factors such as warehouse size, level of automation, volumes handled and starting levels of inefficiency. “However”, Emilio specifies, “industry analyses show that a WMS project, for example, frequently achieves payback within 12 to 24 months, with an average of around 18 months.” The economic benefits derive primarily from:
- reduction in operating costs through more efficient processes and higher operator productivity (typically 20 to 30%)
- reduction in picking, dispatch and labelling errors
- improved inventory accuracy, with consequent reduction in stockouts, overstock and inventory discrepancies (typically from 90% to 99%)
- increased capacity and order fulfilment speed, and improved service levels
To estimate the investment payback period, a straightforward formula can be used:
Payback Period = Total WMS investment ÷ Annual net benefits
Where annual net benefits include labour savings, reduced inventory management costs and any additional revenue generated by increased productivity.
A word of caution: a 99% inventory accuracy rate or an increase in orders fulfilled per hour do not automatically translate into higher revenue.
Additional capacity generates revenue only if there is real demand to serve; data efficiency becomes economic value only if it is reflected in concrete operational and financial decisions. These are important metrics, but they risk becoming vanity metrics if they are not linked to a measurable impact on the income statement.
“Other factors that help give the logistics ROI calculation a fuller picture include the identification of risks mitigated and the potential new opportunities that automation unlocks“, Emilio continues. This is because targeted logistics investments do not only deliver economic benefits: they also help companies to:
- address labour shortages: it is important to estimate, for example, the percentage of tasks that can be maintained with the same number of operators during activity peaks
- improve health and safety: estimating the reduction in workplace incidents resulting from the automation of manual, hazardous and repetitive tasks
- unlock new growth opportunities through digital transformation, which lays the groundwork for continuous improvement: better operational scalability, the generation of clean real-time data, improved decision-making and additional value for stakeholders (for example, client-facing dashboards)
In the specific context of supply chain, a fundamental shift in methodology is also required: moving away from the traditional approach of analysing function by function, and toward analysing the entire process end-to-end. In other words, it is not enough to look at the performance of a single department (procurement, production, logistics, transport), but necessary to extend the analysis to the supply chain as a whole. For example, to understand how a customer order was fulfilled, you would calculate lead time starting from procurement, moving through production, and through to how the order was handled at the transport stage. “You no longer think in terms of functions or silos, as was done 20 years ago”, Emilio continues. “Today that is simply unthinkable, because the landscape has changed completely.”
Deloitte highlights how many companies still suffer from poor end-to-end visibility across the supply chain, a limitation that affects both performance and decision-making capacity.
“A factor that certainly complicates the ROI calculation is the widespread difficulty of measuring and attributing specific results to a given investment”, our Sales Director continues. “This is why data analysis is the essential foundation for assessing the real impact of a logistics project: it makes it possible to evaluate both short-term and long-term benefits, enabling a ROI calculation carried out with rigour and method.” Companies are supported in this by reporting and analytics tools, Business Intelligence platforms and SCES software, all of which can transform operational data into actionable information for identifying inefficiencies and making faster, more informed decisions across the entire logistics process.
Samo ROI supply chain case study
Stesi, a company specialising in supply chain digitalisation, always carries out both an upfront analysis with its clients (to map flows and identify areas for improvement) and a post-implementation assessment of the benefits delivered by its logistics automation projects.
“One of the most significant projects we have ever worked on was the one with Samo“, Emilio Collot recalls. “We started with a complete review of the factory, where even before introducing any tools, a process analysis and a physical layout redesign were carried out. Only after that did Samo introduce the MES software, the and the Stesi carrier interface.”

The final assessment delivered remarkable results. Management time was reduced by 20%, meaning that tasks that previously required a given amount of time to complete, such as drawing up plans, tracking missing components in production or carrying out repetitive activities, were drastically reduced. “Imagine a warehouse operator who used to walk for 20 minutes looking for a part. At Samo, we reduced picking times by 15%“, Emilio explains. Furthermore, thanks to the new component traceability and perpetual inventory features, Samo reduced inefficiencies by 10%, supported by complete visibility across the entire supply chain. Finally, many operations that were previously carried out manually, such as production declarations, material posting and label printing, are now digital and automated, resulting in a 15% reduction in human errors.
There are many aspects that never figure in a logistics anche supply chain ROI calculation, yet their effects and micro-effects accumulate over time and weigh heavily on the company budget. As Emilio concludes: “These are the numbers that really matter. Not so much the line that says ‘how much did it cost me’, but rather: what problems have I solved? How much time are people recovering today? How many low-value activities have been eliminated? How many problems no longer arise?”
Want to understand where your supply chain is losing value? Every inefficiency has a cost. The problem is that it often remains invisible until it becomes a concrete issue. Book 4 hours of free logistics consultancy with Stesi: together we will analyse your processes, pain points and improvement opportunities to increase your competitive advantage and position your business to benefit from the available incentive schemes.

FAQ: ROI supply chain
How do you calculate the ROI of a logistics project?
You compare the economic benefits achieved (reduced times, errors and operating costs) with the total cost of the investment. The challenge in supply chain is making sure you account for all the hidden costs that have been reduced. For complex projects or long-term investments, the simple ROI formula may not be enough. In these cases, more sophisticated tools are used: the payback period (how long it takes the investment to pay for itself), NPV or Net Present Value (which discounts future cash flows to account for the time value of money), and TCO or Total Cost of Ownership (which considers all direct and indirect costs of an investment over its entire lifecycle, not just the initial purchase price). These tools provide a more complete picture when evaluating automation projects whose benefits are distributed over multiple years.
What tools help calculate logistics ROI?
The most commonly used include Business Intelligence software, WMS, MES, TMS, APS and SCES platforms, which make it possible to monitor KPIs such as picking times, resource utilisation, error rates, productivity and operating costs.
What is the difference between ROI and TCO?
ROI answers the question “how much do I gain relative to what I invest?” TCO (Total Cost of Ownership) answers a different question: “how much does it really cost me to own and maintain this solution over time?” TCO includes not only the initial purchase cost, but also licences, maintenance, training, updates and the eventual cost of replacement. Knowing the TCO is essential for calculating an accurate ROI: without accounting for all ownership costs, the return on investment risks being overstated. The two metrics should always be read together, not as alternatives to each other.
How long does it take to recover the investment in a WMS or MES?
Timelines vary depending on project complexity and company size, but in most cases an investment in a WMS or MES pays back within 12 to 24 months. More focused projects targeting a single critical process can generate a faster return. Larger projects involving hardware automation or a complete layout redesign take longer but deliver more structural and lasting benefits over time.